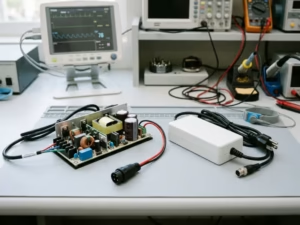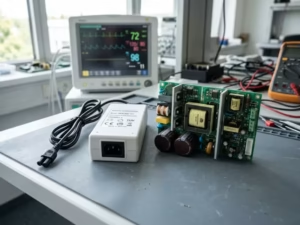
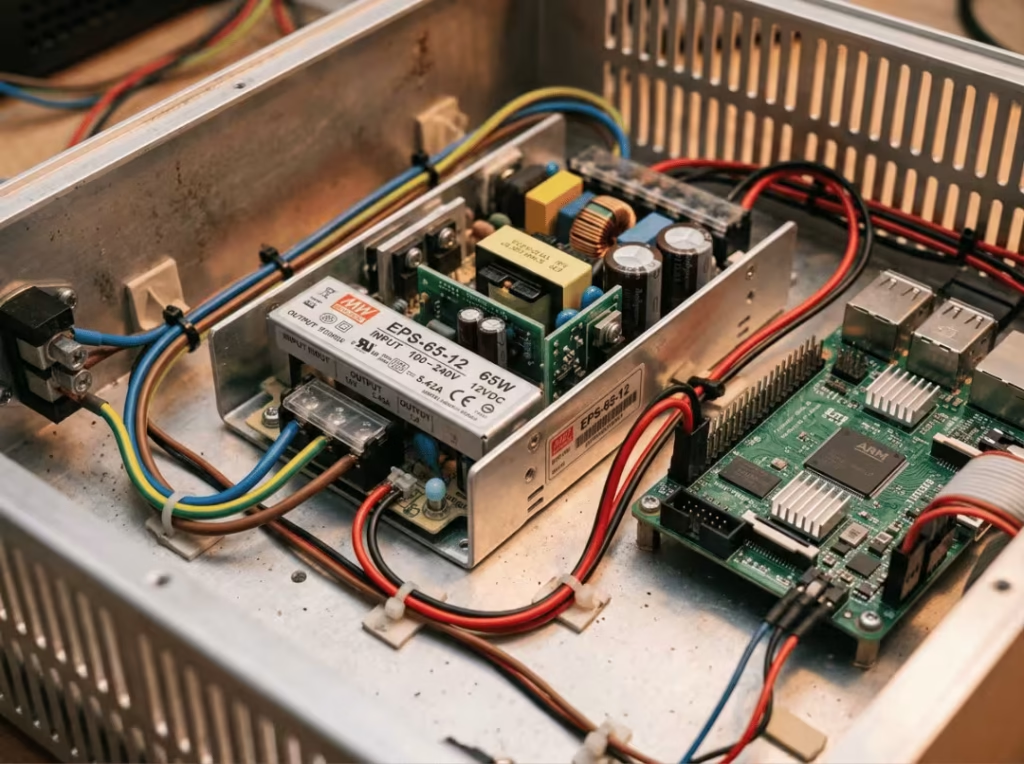
A 150 W power supply passes every test on the bench. At 25 °C in open air, it holds voltage under full load without complaint. Then it goes into the actual product — a sealed enclosure, no fan, mounted next to a warm processor board — and the field returns start arriving six months later. Some units shut down mid-operation. Others just die early. Nothing was defective. The supply was simply asked to deliver 150 W at an internal temperature it was never rated to hold.
That failure was predictable. It was printed on the datasheet, in the one chart most engineers glance at and scroll past: the derating curve. The bench test almost never catches this, because a bench is the one place a supply never has to fight for airflow.
A power rating is a ceiling that holds only under stated conditions — not a promise the supply keeps everywhere. This article walks through how to read that curve properly and how to turn it into a selection decision instead of a footnote you discover at validation.
What a Derating Curve Shows
A derating curve maps usable output against a stress variable. Most often that variable is ambient temperature, but it can also be altitude or input voltage. The curve shows how much power or current the supply can actually deliver as conditions get harder.
Almost every curve has two regions. The first is flat: from the minimum operating temperature up to a breakpoint, the supply delivers its full rated output. A 150 W unit delivers 150 W across this entire range. The second region slopes down. Past the breakpoint, available output falls — usually in a straight line — as temperature climbs toward the maximum operating limit. At that upper limit, the supply may be down to 50 % of nameplate, or lower.
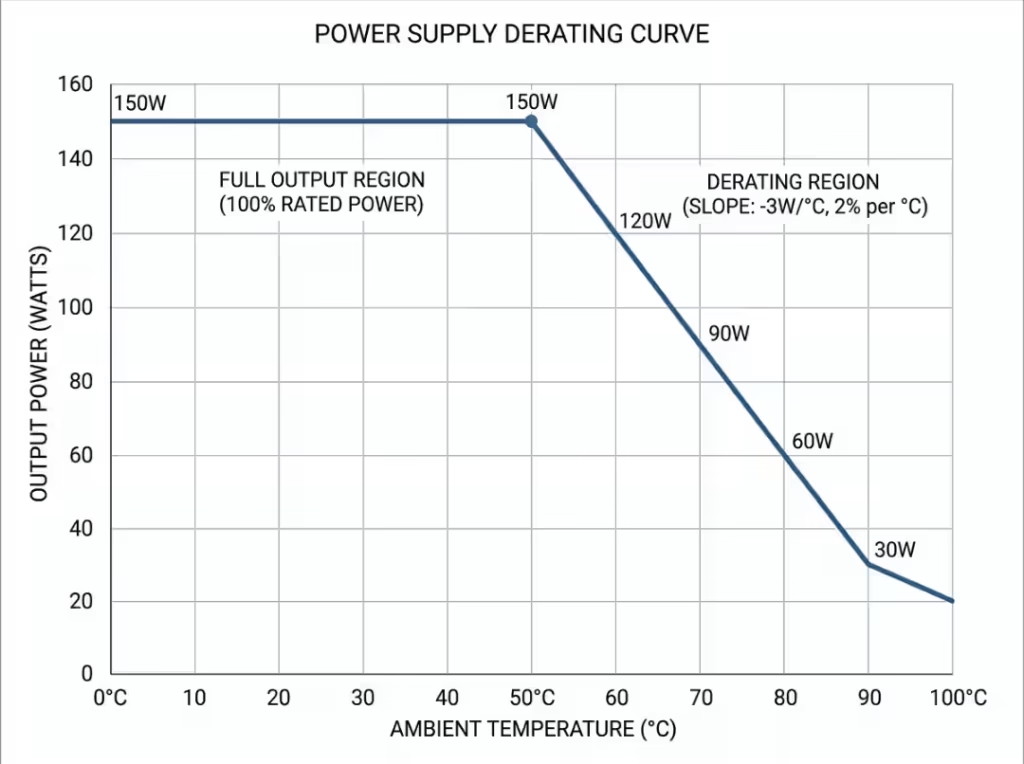
The breakpoint matters more than the endpoints. It is the highest temperature at which you still get everything the label promises. Above it, the headline number no longer holds.
You will find the curve near the electrical specifications, not buried in an appendix. It belongs beside the power rating, because it defines the conditions under which that rating applies. Read the two together, or you are only reading half the spec.
Why Power Supplies Are Derated
Heat is the reason. No power supply is 100 % efficient — the losses turn into heat inside the unit, and that heat pushes internal components above the surrounding air temperature. The hotter the ambient, the less thermal headroom the supply has before its critical parts hit their own limits. Derating is how the manufacturer keeps those parts inside a safe thermal window as load and ambient rise together.
Two forces drive it.
The first is reliability. Component life falls sharply with temperature. The working rule for electrolytic capacitors is that every 10 °C rise roughly halves service life. A cap rated for 10,000 hours at 105 °C might give you 5,000 at 115 °C. Push a supply to full load in a hot box, and you are not usually risking an immediate failure — you are quietly trading away years of field life you assumed you had.
The second is safety. Semiconductor junctions, transformer windings, and PCB traces all have hard thermal limits. Cross them, and you get insulation breakdown, thermal runaway, or a fire risk. Derating keeps the worst-case combination of load and ambient below those limits with margin to spare.
So the sloped part of the curve is not the manufacturer being cautious for its own sake. It is the boundary between a supply that meets its rated life and one that ages fast or fails outright.
How to Read a Derating Curve Correctly
This is where selection errors start, so it is worth slowing down. Get the axes wrong and everything downstream is wrong.
Step 1 — Confirm the X-axis. It is usually ambient temperature, but check. Some datasheets plot case temperature or load percentage instead. Ambient and case temperature are not interchangeable, and mistaking one for the other is the most common reading error.
Step 2 — Confirm the Y-axis. This is typically output power, output current, or a percentage of rated load. A current-limited curve reads differently from a power-limited one, so know which you are looking at before you trace anything.
Step 3 — Check the cooling assumption. Find whether the curve was drawn for convection (still air) or forced-air cooling. If the graph has two lines, the higher one is almost always forced-air. Read the line that matches how your product actually cools — reading the forced-air line for a fanless design is a direct route to an oversubscribed supply.
Step 4 — Find the breakpoint. Locate where the flat, full-rated region ends and the slope begins. That temperature is your ceiling for full output.
Step 5 — Trace your worst-case ambient to the curve. Go up from the highest local temperature the supply will really see, hit the line, and read across to the Y-axis. That value — not the headline rating — is what the supply delivers in your conditions. Then confirm your continuous load sits below it, with margin. Sitting exactly on the line leaves nothing for component aging, hot spots, or a bad day at the top of your temperature range.
A worked example
Take a 150 W supply with a breakpoint at 40 °C and a linear derate to 50 % output at 70 °C. Your enclosure runs at 55 °C worst case.
- The derating band is 40 °C to 70 °C — a span of 30 °C — over which output falls from 100 % to 50 %.
- 55 °C sits 15 °C into that band, so you have used half the available derate.
- Half of the 50-point drop is 25 points, leaving you at 75 % of rating: about 112 W.
If your load is 105 W, you are just under the line with a thin margin — workable, but not comfortable for a long-life product. If your load is 130 W, this supply cannot do the job at 55 °C, no matter what the front-page 150 W number says. You either drop the load, improve cooling, or size up.
Ambient vs Local Ambient vs Case Temperature
This is the distinction that sends good designs back for rework, so read it carefully.
There are three temperatures at play, and they are not the same number:
- Room temperature — the air in the space the product sits in.
- Local ambient — the air immediately around the supply inside its enclosure, in its real mounting.
- Case (or hot-spot) temperature — the temperature at a specific point on or inside the unit.
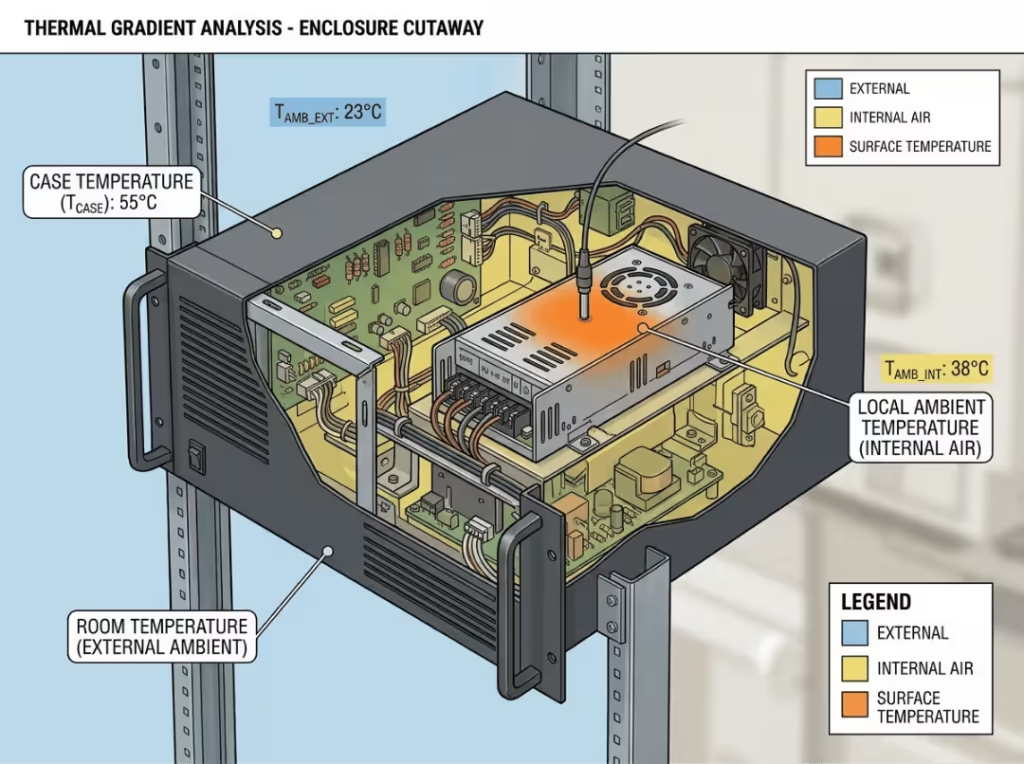
The trap is that most derating curves are plotted against ambient, and the ambient the manufacturer means is local ambient, not room temperature. On an open bench, room air and local ambient are close, so the lab measurement looks generous. Seal the same supply in a still-air enclosure, and local ambient temperatures climb well above the room temperature because the supply’s own heat has nowhere to go. The gap inside a closed box can be 20 °C or more.
Here is how that plays out. You read the curve against a 25 °C room. The supply actually lives at 50 °C local ambient. You planned around full output; the curve at 50 °C gives you far less. The bench told you the supply was fine. The enclosure disagreed, quietly, until the field returns arrived.
The practical rule is simple. Measure the temperature at the point specified in the datasheet, in the mechanical configuration the product will actually ship in. If the curve references ambient in free air and your supply sits in a sealed cabinet, you need the local air temperature inside that cabinet — not the room the cabinet stands in. If the datasheet specifies a maximum case temperature, measure the case temperature, not the ambient air. Getting this right during design costs an afternoon. Discovering it during thermal validation costs a spin.
Common Derating Scenarios in Real Products
The same supply behaves differently depending on where it lives. Four cases cover most of what you will meet.
Open-frame supply in a ventilated rack
Risk: low, but deceptive. Air moves freely across the board, local ambient stays close to room temperature, and output holds near full rating.
How to read the curve: the convection line at near-room ambient applies. You get most of what the label promises.
Selection approach: this is close to bench conditions, which is exactly why success here tells you little about other installations. Do not let a good rack result stand in for a sealed-box design.
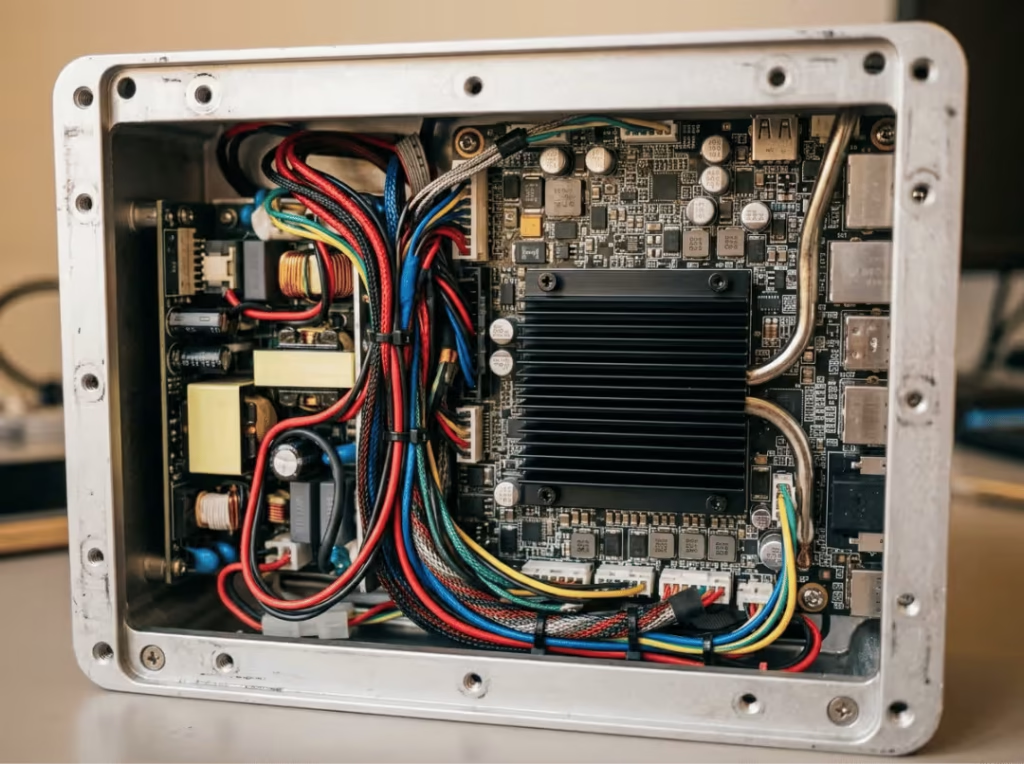
The same open-frame unit in a sealed, fanless enclosure
Risk: high. The heat the supply generates warms the trapped air, local ambient rises, and you slide down the derating slope. A part that gave you 150 W in the rack might give you 100 W here.
How to read the curve: read the convection line at the elevated local ambient inside the box — not room temperature. That is your true operating point.
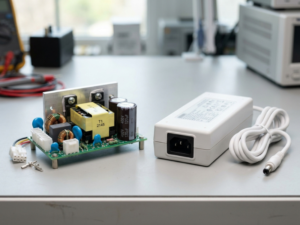
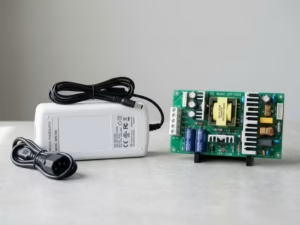
Selection approach: either improve heat removal, drop the load, or move to a higher-rated part. When the mechanical design forces this tradeoff, choosing between an open-frame and an enclosed supply becomes a thermal decision as much as a mechanical one.
Fanless medical device with restricted airflow
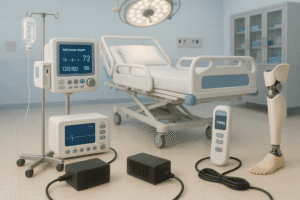
Risk: high, and constrained by more than heat. Fanless designs are common in patient-adjacent equipment where noise and contamination rule out moving air. Headline ratings quietly disappear, and derated output governs.
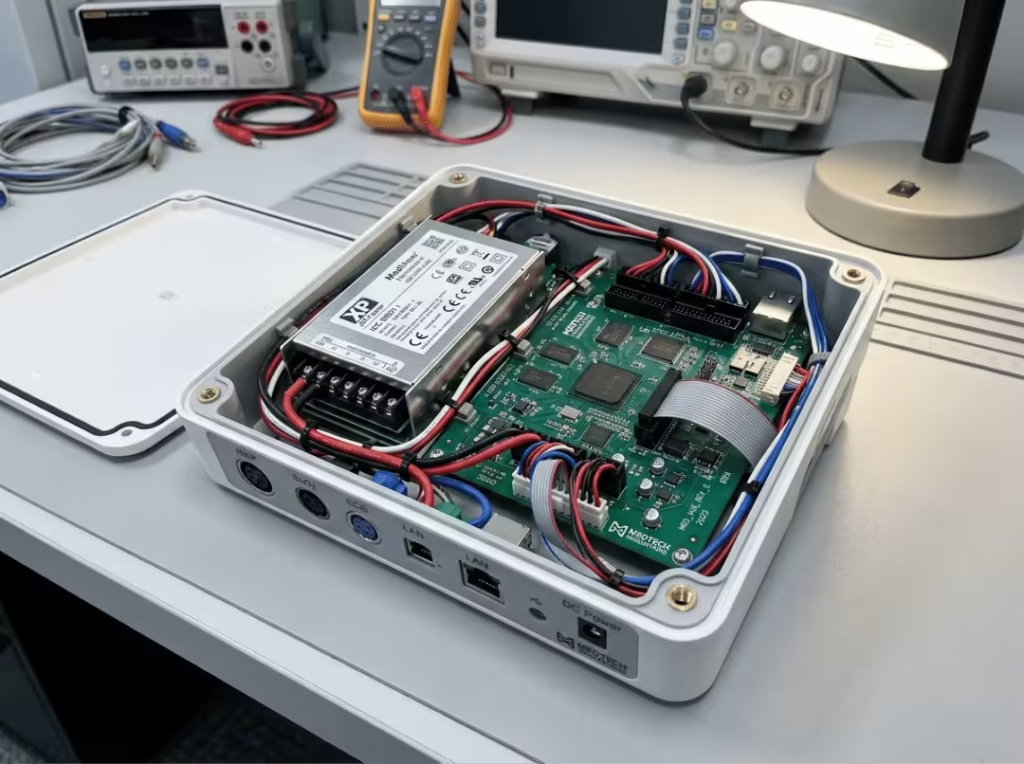
How to read the curve: the convection line at a deliberately warm local ambient. Treat the derated number as the design number, not as a worst-case you might occasionally touch.
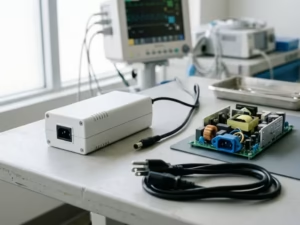
Selection approach: here the curve is not a formality — it is the number you build around. Because patient contact also sets isolation and leakage limits, thermal derating is only one axis of the decision. A supply chosen for its medical AC-DC power characteristics has to meet the thermal and safety envelopes simultaneously, and those two rarely push in the same direction. When patient protection sets your isolation requirement, the difference between MOOP and MOPP under IEC 60601-1 belongs in the selection alongside the derating curve, not after it.
High-ambient industrial cabinet
Risk: moderate to high, but at least it is honest — nobody expects a factory cabinet at 50–60 °C to be gentle.
How to read the curve: you are well into the derating region from the start, so read output at the elevated ambient and treat that as your baseline. A supply rated at 200 W at 40 °C may only deliver 130 W at 60 °C.
Selection approach: size for the derated output from day one. 130 W is the number your load has to fit under, not 200 W.
Common Mistakes in Power Supply Selection
Five errors account for most derating-related failures.
Treating rated wattage as available at any temperature. The nameplate figure holds only up to the breakpoint. Above it, the real number is lower — often much lower. Sizing to the headline rating in a hot environment is the single most frequent mistake.
Confusing room temperature with local ambient. Reading the curve against room air, when the supply lives in a sealed box, overstates the available output by a wide margin. The supply operates at its local temperature, and the box is warmer than the room.
Ignoring the cooling assumption. A curve drawn for forced-air cooling does not apply to a fanless design. Read the wrong line, and you are counting on airflow the product does not have.
Sizing to the curve with zero margin. Placing your load exactly on the derated line leaves nothing for component aging, manufacturing spread, or the high end of your temperature range. Leave 20–30 % headroom below the line.
Overlooking altitude and low-line input. Both stack on top of thermal derating. Thinner air at altitude cools less effectively; low input voltage raises input current and internal losses. A design validated at sea level on nominal input can fall short at elevation or on a sagging line, because the derates compound rather than average.
How to Use Derating Curves in Power Supply Sourcing
The curve is a sourcing tool. Used in order, it filters out supplies that cannot do the job before you commit to them.
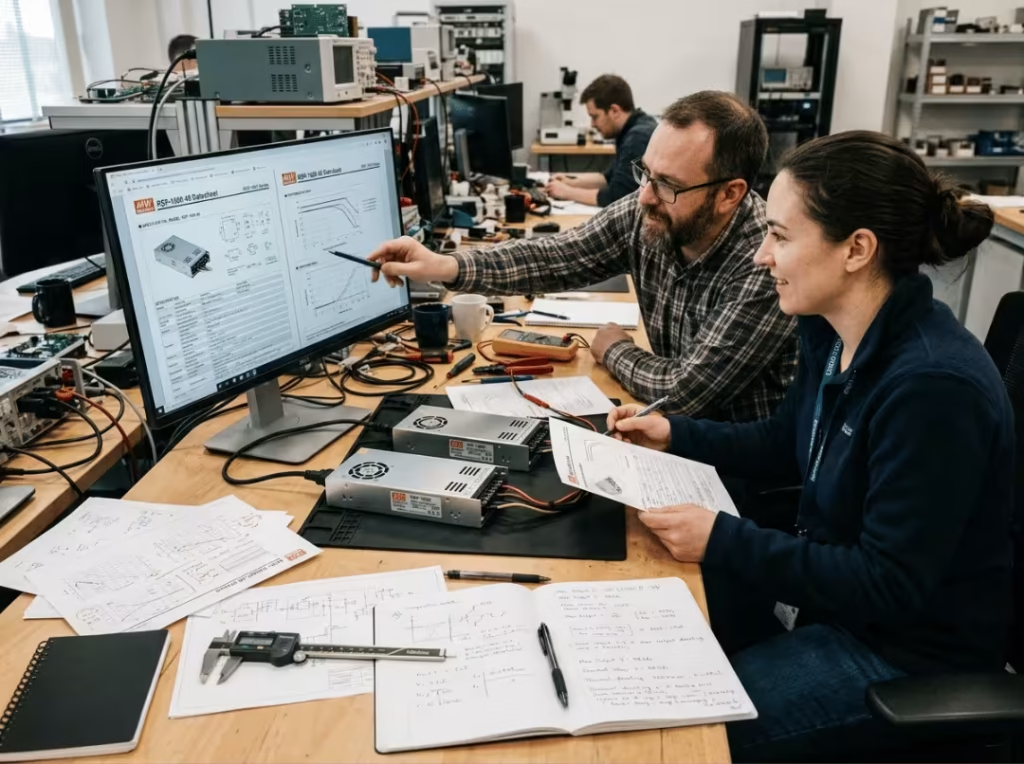
Define the worst-case local ambient conditions and the cooling method first. Fix the highest local temperature the supply will see in its actual mounting, and decide whether cooling is by convection or forced air. Every later step depends on these two numbers, and getting them wrong invalidates everything downstream.
Compare candidates on derated output, not headline figure. Read each supply’s output at your worst-case ambient. A 200 W unit that derates hard can lose to a 180 W unit with a flatter curve at 55 °C. The front page tells you almost nothing on its own.
Prefer the flatter, later-breaking curve when your application runs hot. Between two parts at the same rating, the one that holds output further up the temperature range gives you more real margin for the same money.
Add margin for duty cycle and aging. Leave 20–30 % below the derated line. Use the higher end for continuous-duty and long-life products, since component aging eats headroom over years, not hours.
Escalate early when nothing fits. If no standard supply can hold your load at your temperature with margin, size up or specify a custom unit before the layout freeze. Understanding how the switching power supply topology and selection tradeoffs work helps here, because the right answer is sometimes a different design rather than a bigger box. Discovering the shortfall at validation is expensive; catching it during sourcing is not.
Frequently Asked Questions
What does a derating curve actually tell me?
It shows how much power or current a supply can deliver as ambient temperature, altitude, or input voltage moves away from ideal conditions. Below the breakpoint, you get full rated output; above it, available output falls. The curve, not the nameplate, is the real output ceiling in your conditions.
Why can’t I just trust the nameplate wattage?
Because the nameplate holds only up to the breakpoint temperature. In a hot or sealed enclosure, the supply operates in the sloped region, where real output can be well below the label — sometimes half. The nameplate is the best case, not the design case.
Is derating based on ambient or internal temperature?
Most curves are plotted against ambient — but the ambient the datasheet means is the local air around the supply in its mounting, not the room. Inside a sealed box, local ambient can run 20 °C or more above room temperature, so always measure at the point the datasheet specifies.
How much margin should I leave below the derated line?
Leave 20–30 %. Use the higher end for continuous-duty or long-life products, because component aging erodes headroom over the product’s life. Sizing exactly to the curve leaves nothing for hot spots, part-to-part spread, or the top of your temperature range.
Why does my supply pass on the bench but fail in the product?
The bench sits in the open air, where the ambient temperature is close to room temperature. Your product seals the supply in a warmer box, so local ambient climbs and available output drops. The bench never reproduces the enclosure’s thermal conditions, so it overstates what the supply can deliver in the field.
Does derating change for fanless or medical designs?
Yes. Fanless products rely on the convection line at an elevated local ambient, so derated output — not nameplate — is the design number. Medical designs add isolation and leakage requirements on top, which means the supply has to satisfy both the thermal and the safety envelope at once.
The Derating Curve Is a Selection Constraint, Not a Footnote
Read against real conditions, the derating curve turns a headline wattage into a number you can actually design around: what the supply delivers in your enclosure, at your temperature, with your cooling. That is the only output that matters once the product ships.
The decision rule holds across every application. Size to derated output at worst-case local ambient, match the cooling line to your actual enclosure, and leave a 20–30% margin below the line. A supply chosen that way survives its duty cycle. One chosen on nameplate wattage alone becomes a field return you could have seen coming.
If you are specifying a supply for a hot cabinet, a fanless medical device, or any sealed enclosure, match the part to your operating conditions rather than its front-page rating. When no standard unit provides the output where you need it, send your worst-case local ambient, cooling method, and continuous load — and let the specification start from the governing number, not the one on the label.