MTBF vs life expectancy is one of the most misread comparisons in hardware engineering. MTBF measures the average time between failures across a large population during useful life. Life expectancy indicates when a single unit wears out and is no longer economical to repair. They are not the same number, and treating them as one leads to poor purchasing decisions, mismatched warranty expectations, and spare parts plans that fall short. This guide untangles MTBF, reliability, and life expectancy, walks through the MTBF formula, explains the bathtub curve reliability model, and shows how to turn these metrics into real decisions.
MTBF, Reliability, and Life Expectancy at a Glance
Before we go deep, here’s the quick answer. These three terms answer three different questions, and knowing which is which saves you from the most expensive mistakes.
Metric | What it measures | Best used for | What it does not tell you |
|---|---|---|---|
MTBF | Average time between failures across a population during useful life | Comparing random failure rates between components or vendors | The exact lifespan of any single unit |
Reliability | Probability of failure-free operation over a set period under set conditions | Estimating performance over a defined time and environment | When wear-out will physically arrive |
Life Expectancy | Practical service life until wear-out or uneconomical repair | Replacement planning and end-of-life budgeting | The random failure rate during useful life |
Keep this table in mind as you read. Nearly every misunderstanding about the MTBF reliability life expectancy trio traces back to blurring the boundaries among them.
What MTBF Actually Measures
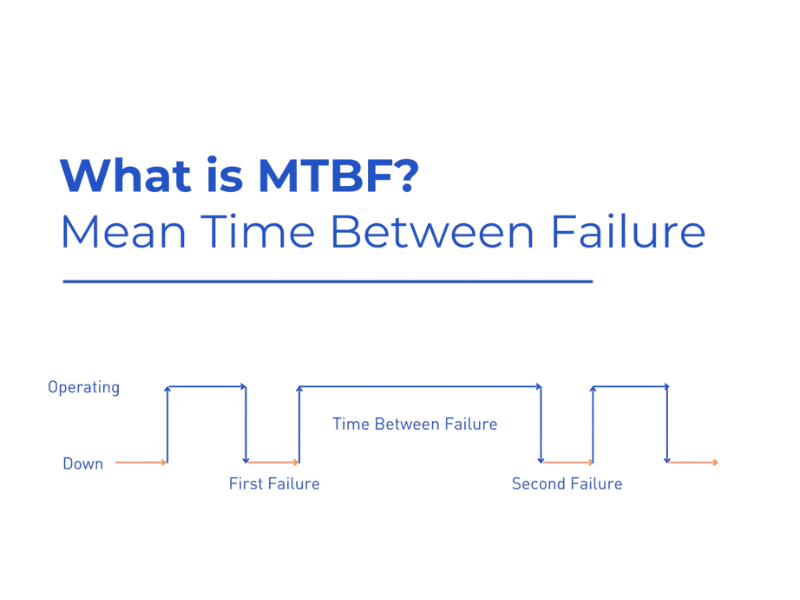
MTBF (Mean Time Between Failures) is a statistical probability, not a countdown for one device. It describes the expected interval between failures across a large population of identical units running under defined conditions.
Think of an insurance actuary. They can tell you the average life expectancy of 100,000 people, but they cannot tell you when any single person will die. MTBF works exactly the same way for hardware: it describes a population, not an individual.
The MTBF Formula
The MTBF formula is simple:
MTBF = Total operating time ÷ Number of failures
You take the combined uptime across all units in a test population and divide it by the number of failures observed. Run 1,000 lightbulbs for 1,000 hours each, and you get one million cumulative operating hours. If one bulb fails during that window, MTBF = 1,000,000 hours.
Population vs. Individual
That million-hour figure makes it seem like each bulb should last 114 years. It won’t. You only tested the population for 1,000 hours. The number tells you the failure rate during the observation window, not how long any single unit physically survives.
So what? A 500,000-hour MTBF for a power supply does not mean your unit will run for 57 years. It means across a large batch, expect one failure every 500,000 cumulative operating hours during useful life.
Why MTBF Does Not Equal Product Lifespan
The most common and most costly misconception is that MTBF predicts when a product will die. It doesn’t. This is the heart of the MTBF vs life expectancy confusion.
Take a component with a 100,000-hour MTBF. On paper, that looks like roughly 11.4 years of guaranteed operation. It isn’t guaranteed at all. MTBF assumes a constant failure rate during useful life and ignores wear-out entirely.
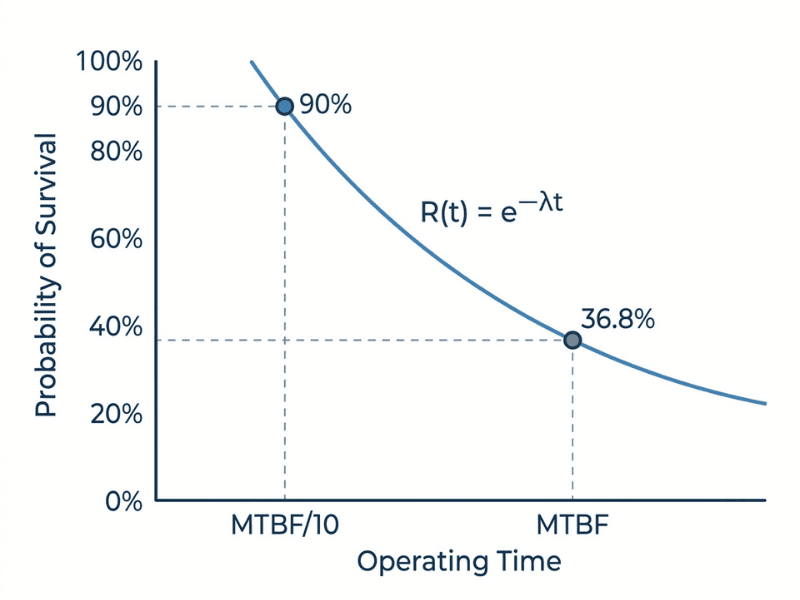
The reliability curve tells the real story. For a component with a constant failure rate, only about 36.8% of units statistically survive to reach their full MTBF figure. Roughly 90% survive to just one-tenth of that number. So the 100,000-hour figure describes probabilities during useful life, not a lifespan clock.
Watch out for this common mistake: never read an MTBF value as “years until failure.” It was never designed to carry that meaning.
How Reliability Is Different From MTBF
Reliability is closely related to MTBF but answers a narrower question. Formally, it’s the probability that a unit will perform correctly for a specified period, under specified conditions, without failure.
Two qualifiers do the heavy lifting here. “Correctly for a specified period” ties reliability to time. “Under specified conditions” ties it to environment. Change the temperature, load, or duty cycle, and the reliability figure changes accordingly.
You can express reliability with the failure rate, written as lambda (λ), which is the inverse of MTBF:
λ = 1 ÷ MTBF
If MTBF is 1,000,000 hours, λ is 0.000001 failures per hour. They move in opposite directions: a lower failure rate means a higher MTBF. When you build a system from many parts, you sum their individual failure rates. That’s why a system is never more reliable than its weakest link, and why smart designers strengthen the weakest components rather than over-engineer the strong ones.
Where Life Expectancy Fits In
Life expectancy is a physical limit, not a probability. It’s the point at which a product enters wear-out or is no longer economical to repair. A high MTBF and a short life expectancy can live comfortably in the same product.
Physical wear-out factors cap life expectancy no matter how good the MTBF looks:
- Capacitor dry-out. Electrolytic capacitors lose electrolyte over time, especially in heat. This is often the first thing to kill a power supply.
- Bearing friction. Fans and motors have mechanical bearings that wear down with use.
- Thermal cycling. Repeated heating and cooling fatigues solder joints and connections.
Environmental Stress Changes Everything
Consider two components with an identical 200,000-hour MTBF. Install one in a climate-controlled cabinet and the other beside a heat source at 70°C. The hot unit may reach wear-out in a fraction of the time, even though both share the same MTBF rating. Heat, humidity, vibration, and dust shorten service life without touching the datasheet number.
Here’s what to do first: preventative maintenance reclaims life. Swap worn fans, clean dust from heat sinks, replace aging capacitors, and you push wear-out further out. The MTBF stays the same, but useful service life extends considerably. That gap is exactly where maintenance programs earn their keep.
The Bathtub Curve Explained
The relationship between failure rate and time is best shown by the bathtub curve reliability model, named for its shape. It has three distinct phases.
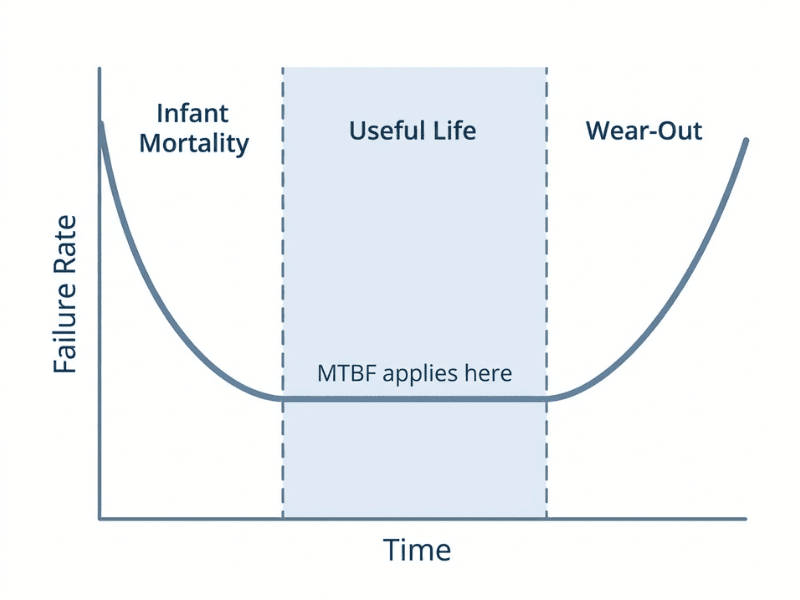
Phase 1: Infant Mortality
Early in life, failure rates start high but drop fast. These failures come from manufacturing defects, weak solder joints, damaged parts, or assembly errors. Manufacturers often “burn in” products to catch these before shipping, so the units you receive are past the steep front slope.
Phase 2: Useful Life
This is the long, flat bottom of the tub. Failures still happen, but randomly and at a low, roughly constant rate, driven by events like voltage spikes rather than age. This is the only phase MTBF actually describes.
Phase 3: Wear-Out
At the far end, failure rates climb sharply as components physically degrade. Capacitors dry out, bearings wear, insulation breaks down. This is where life expectancy lives.
So what? MTBF only applies to the flat middle. Use it to predict end of life, and you’re applying a metric to a region of the curve it was never built to cover.
MTBF vs MTTF vs MTTR
These three acronyms get swapped around constantly, so let’s separate them cleanly. Understanding MTBF vs. MTTF, in particular, clears up a lot of confusion in datasheets.
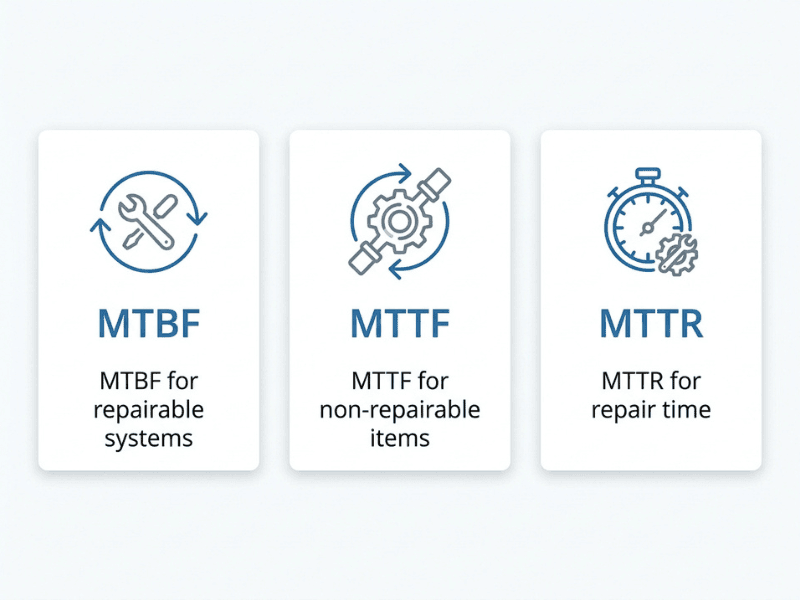
- MTBF (Mean Time Between Failures) applies to repairable systems, in which you repair a unit and return it to service. The “between” implies repair.
- MTTF (Mean Time To Failure) applies to non-repairable items you simply replace, like a fuse or a single capacitor. The “to” implies replacement, not repair.
- MTTR (Mean Time To Repair) measures the time required to repair a failed unit and restore service.
The Availability Formula
Reliability and repair time together determine availability, the percentage of time a system actually works:
Availability = MTBF ÷ (MTBF + MTTR)
Here’s why this matters. A system with modest MTBF but fast, easy repairs can deliver higher availability than one with a stellar MTBF that takes days to fix. For uptime-critical operations, MTTR deserves as much attention as MTBF.
Why Vendor MTBF Figures Are Hard to Compare
Two datasheets can both claim “500,000 hours MTBF” and mean completely different things. Before you compare figures across vendors, check how each number was produced.
- Prediction standard. Was it calculated using MIL-HDBK-217, Telcordia (SR-332), or another model? Each method makes different assumptions and produces different results for the same hardware.
- Temperature assumptions. A figure generated at a benign 25°C means little if your equipment runs at 55°C. Higher temperatures accelerate failure rates dramatically.
- Calculated vs. field data. A number modeled on paper is not the same as one observed in real deployments. Field data is generally more trustworthy but harder to find.
- Load and duty cycle. A machine running steadily 24/7 experiences different stresses than one cycling on and off dozens of times a day.
If you’re stuck comparing two components, normalize the conditions first. Otherwise you’re comparing apples to blast furnaces.
How to Use These Metrics in Purchasing and Maintenance
Datasheets are marketing documents as much as they are engineering documents. Here’s how to turn MTBF, reliability, and life expectancy into grounded decisions.
Look at the warranty. Warranty length often tells you more about real-world life expectancy than MTBF does. Manufacturers invest in warranties, so a generous one signals genuine confidence. A million-hour MTBF paired with a one-year warranty should raise an eyebrow.
Calculate spares from failure rates. Run 500 units with a known failure rate, forecast annual failures, and stock accordingly. This avoids both costly downtime and wasteful over-ordering.
Use redundancy for critical loads. A second power supply in a redundant setup dramatically improves system reliability even though each unit keeps its original MTBF. The architecture improved, not the component.
Before you commit to a component, run this quick checklist:
- What temperature was assumed for the MTBF figure?
- Which prediction standard was used?
- Is the number calculated or field-observed?
- Does it refer to a single component or the whole system?
- What is the stated warranty?
- Which parts are the wear-out limiters (fans, capacitors, bearings)?
So what? For hard-to-reach installations or mission-critical systems, prioritize high-reliability parts and a clear end-of-life plan. The upfront cost is trivial next to an emergency service call to a remote site.
Common Questions About MTBF and Life Expectancy
Does MTBF mean expected lifespan?
No. MTBF describes the random failure rate of a population during useful life. Lifespan is governed by wear-out, which MTBF ignores entirely. A 100,000-hour MTBF does not promise 11 years of service.
What is the difference between MTBF and life expectancy?
MTBF measures the average time between failures across many units over their useful lives. Life expectancy is the practical service life of a single unit until wear-out or uneconomical repair. One is a population statistic; the other is a physical limit.
What is the difference between MTBF and MTTF?
MTBF applies to repairable systems that you fix and return to service. MTTF applies to non-repairable items that you replace outright, such as a fuse. The math is similar, but “between” implies repair and “to” implies replacement.
Does MTBF include the time it takes to fix a broken part?
No. Repair time is captured by MTTR, a separate metric. MTBF measures the interval between failures; MTTR measures recovery. You need both to calculate true system availability.
Can a product have a high MTBF but a short warranty?
Yes, and it happens often. MTBF reflects the random failure rate over the useful life, while warranty reflects confidence in the absence of wear-out and defects. A product can have a low random failure rate yet contain components that wear out fast.
Is a higher MTBF always better?
Not necessarily. Higher MTBF usually costs more. For low-stakes applications where downtime is cheap, and repairs are quick, that premium may not pay off. Match the metric to the consequence of failure.
How do you calculate MTBF if a product has never failed?
You use total accumulated operating hours with a statistical confidence level rather than a raw failure count. Analysts apply a chi-squared distribution to estimate a lower-bound MTBF at, say, 60% or 90% confidence, yielding a conservative figure rather than an infinite one.
Why do hard drive makers use different metrics than power supply makers?
Hard drives often use Annualized Failure Rate (AFR) and workload ratings because their failure rates are tied to usage and write-cycle limits. Power supplies lean on MTBF because their useful-life failures are more random and temperature-driven. Different failure physics call for different metrics.
Final Takeaway
MTBF, reliability, and life expectancy each answer a different question. MTBF describes the random failure rate of a population during useful life. Reliability describes the probability of correct operation over a set period under set conditions. Life expectancy describes when physical wear-out arrives. Treat them as one number, and you’ll misjudge budgets, warranties, and maintenance schedules.
Your next step is practical: revisit one component you’re currently specifying, pull its datasheet, and run it through the purchasing checklist above. Check the assumed temperature, the prediction standard, and the warranty against the claimed MTBF. That single exercise will show you exactly where the MTBF vs life expectancy gap hides in your own equipment, and how to plan around it before it costs you.
Ready for power that survives the field, not just the datasheet?
Quankang delivers high-MTBF, IEC60601-certified power supplies with 35-year lifespan support, so your device stays certified and your supply chain stays stable. Send us your specs and our FAE returns a compliance gap analysis within 24 hours.