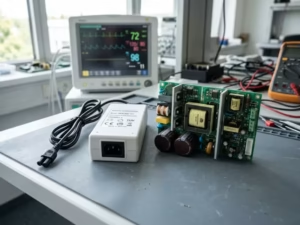
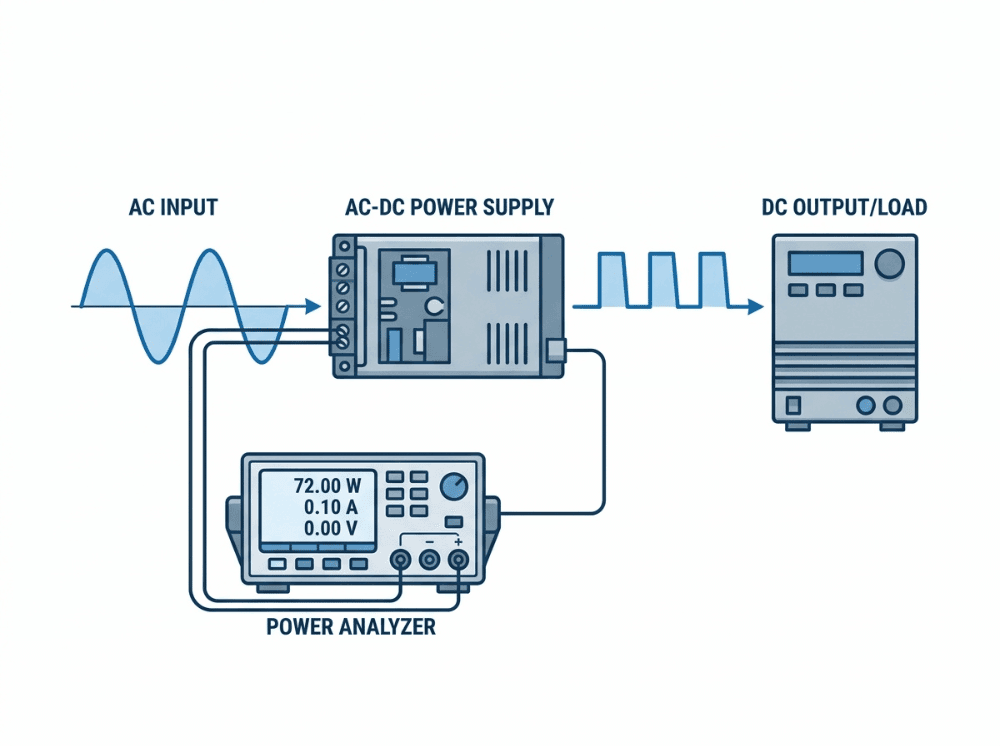
AC-DC power supply efficiency must be measured using real power (watts), not apparent power (VA). Ignoring power factor and total harmonic distortion (THD) can produce efficiency readings that are off by 30 percentage points or more—enough to cause failed audits, regulatory non-compliance, and costly redesigns. A true-power meter is essential for accurate results under EN 61000-3-2 and DoE Level VI test protocols.
An efficiency figure is only as useful as the measurement behind it. Engineers who rely on the wrong instrument—or the wrong quantity—can produce results that look credible on paper but fail at the certification stage. For teams developing ITE or medical power supplies, the downstream consequences are significant: failed DoE Level VI audits, EN 61000-3-2 harmonic current violations, delayed product launches, and redesign cycles that should never have been necessary.
This article breaks down the core measurement errors, explains the physics behind them, and provides a practical protocol for generating accurate, defensible efficiency data—the kind that holds up to regulatory scrutiny.
Why AC-DC Efficiency Measurements Are Often Wrong
The fundamental problem is a unit confusion. Many engineers calculate AC input power by multiplying the RMS voltage by the RMS current. The result is apparent power, measured in volt-amperes (VA). Efficiency is then computed as DC output power divided by this VA figure.
The error seems minor. The consequences are not.
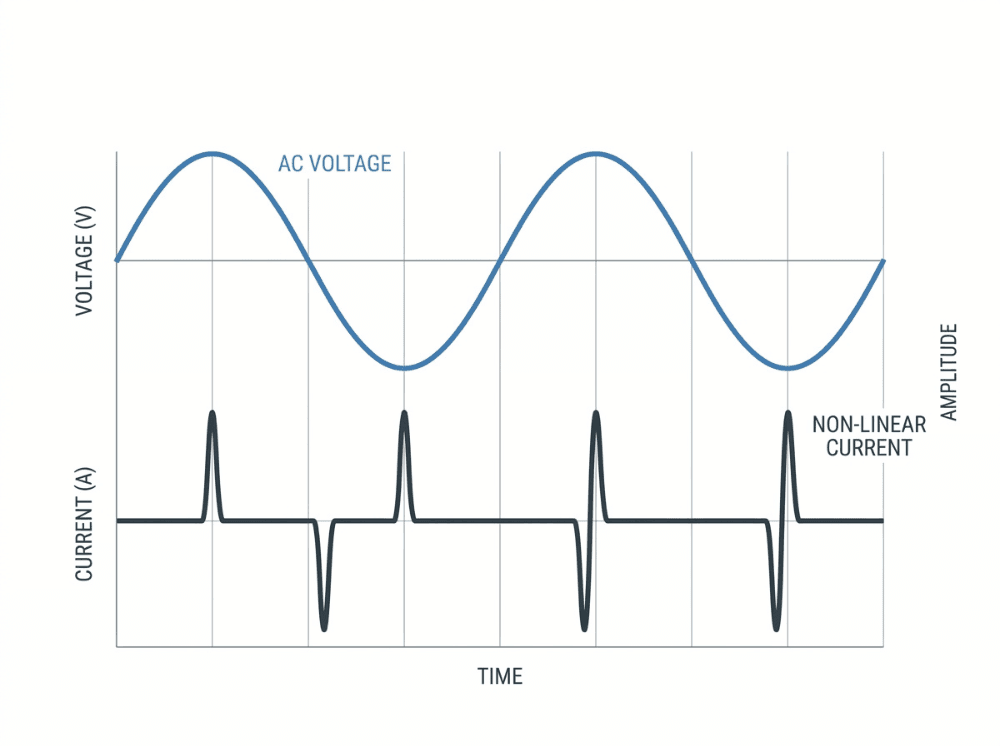
Modern switching power supplies draw current in brief, high-amplitude pulses rather than a smooth sinusoidal wave. This creates significant harmonic distortion, which widens the gap between apparent power and the real power (watts) the supply actually draws from the grid. When apparent power stands in for real power, the efficiency calculation is systematically optimistic—often by 20 to 40 percentage points, depending on the load condition and power factor.
That gap is what causes products to pass internal benchmarks and fail external audits.
Apparent Power (VA) vs. Real Power (W): What’s the Difference?
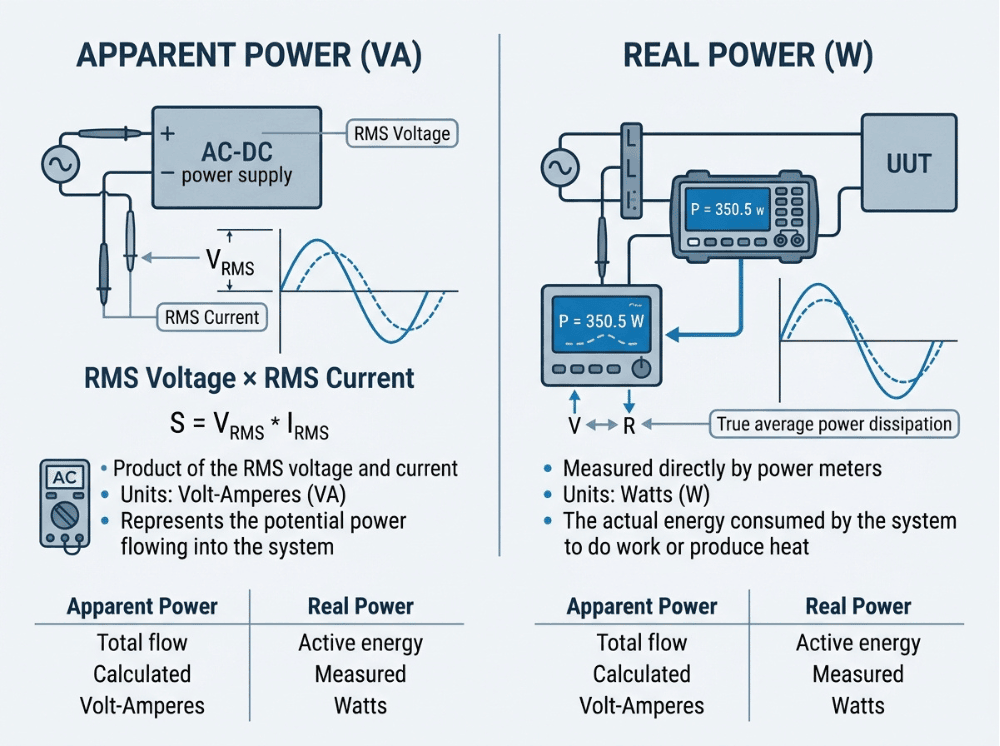
These two quantities are related but not interchangeable, and the distinction is central to any valid efficiency test.
Real power (P), expressed in watts, is the rate at which the supply actually converts energy into usable work. It accounts for both the magnitude and the timing relationship between voltage and current. This is the quantity that matters for heat generation, energy costs, and regulatory compliance.
Apparent power (S), expressed in volt-amperes, is simply the product of RMS voltage and RMS current. It carries no information about waveform shape or phase relationship. For purely resistive loads drawing sinusoidal current, S and P are numerically equal. AC-DC switching supplies do not behave this way.
Reactive power (Q), measured in volt-amperes reactive (VAR), is power that oscillates between the source and the load without being consumed. It contributes to apparent power but not to real power.
The relationship between them:
S² = P² + Q²
Power factor (PF) = P / S
When power factor is 1.0—ideal, resistive behavior—real and apparent power are identical. When the power factor drops to 0.6 (common in switching power supplies operating at light load), the apparent power is 67% higher than the real power. Using the apparent power figure in an efficiency calculation produces a result that is meaningfully lower than the true efficiency—or, depending on how the formula is arranged, meaningfully inflated.
How Power Factor and THD Create the Measurement Gap
The power factor of an AC-DC switching supply has two components, and understanding both is important for accurate measurement.
Displacement power factor results from the phase shift between the voltage and current fundamentals. In early linear supplies, this was the dominant source of power factor degradation.
Distortion power factor results from harmonic content in the current waveform. Switching supplies draw current in narrow pulses synchronized with the voltage peaks, generating substantial harmonic currents at 3rd, 5th, 7th, and higher odd harmonics. These harmonics do not contribute to real power transfer but do increase the RMS current and, by extension, apparent power.
Total harmonic distortion (THD) quantifies this harmonic content. High THD directly reduces distortion power factor and therefore the overall power factor of the supply. A switching supply without active power factor correction (PFC) may exhibit THD of 80–120% and a power factor of 0.5–0.6 under partial-load conditions, when the measurement gap between VA and W is widest.
For test engineers, this means the error is not constant across load conditions. Efficiency measurements taken at 25% load will carry more distortion-induced error than measurements at 100% load, which is particularly relevant for DoE Level VI testing, where performance at 25% load is explicitly evaluated.
Why Oscilloscopes Are Not Sufficient for AC Input Power Measurement
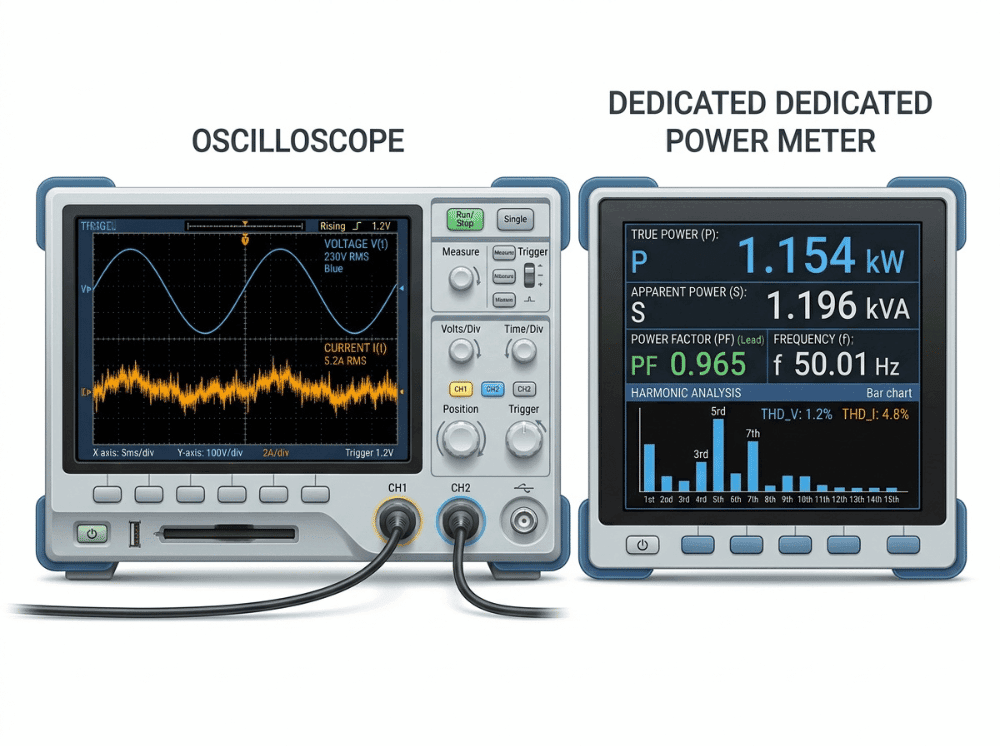
A common workaround is to use an oscilloscope with voltage and current probes to capture waveforms and compute power manually. This approach has legitimate uses in waveform analysis and fault diagnosis, but it introduces meaningful limitations when accuracy matters.
The core issue is that real power calculation requires accurate multiplication of instantaneous voltage and current samples over a complete cycle—a process sensitive to timing alignment, probe bandwidth, probe insertion impedance, and sampling resolution. Current probes, particularly clip-on types, add insertion impedance that perturbs the measurement and introduces phase errors that directly affect the power calculation.
Oscilloscopes also have a limited dynamic range compared to dedicated power analyzers. Low-level harmonic components may be below the noise floor or poorly resolved, leading to underestimated THD and inaccurate power factor readings.
None of this means oscilloscopes have no place in efficiency testing. For waveform visualization, switching transient analysis, and ripple measurement, they are indispensable. For regulatory-grade AC input power measurement, a dedicated true-power meter with harmonic analysis capability is the appropriate tool.
How to Measure Power Supply Efficiency Correctly with a Power Meter
A true-power (wattmeter-class) power meter directly measures real power by computing the mean of instantaneous V × I products across the full measurement period. This approach inherently accounts for phase displacement and waveform distortion without requiring any separate power factor calculation or correction.
Key instrument requirements for compliance-grade testing:
- Measurement bandwidth: ≥100 kHz to capture significant harmonic content (EN 61000-3-2 evaluates harmonics up to the 40th, at 2 kHz for a 50 Hz system)
- Current measurement method: Hall-effect or precision shunt, not clip-on inductive probes
- Power factor display: Confirm the meter reports true PF based on real and apparent power, not estimated from phase angle alone
- Crest factor handling: Switching supplies can exhibit crest factors of 3–5; the meter’s current input must handle peak currents without clipping
- Integration time: Use a minimum of 10 complete line cycles (200 ms at 50 Hz, 167 ms at 60 Hz) to average out switching noise
Measurement setup checklist:
- Stabilize AC source voltage at the test level (115V/60Hz or 230V/50Hz) before taking readings
- Allow the supply under test to reach thermal equilibrium at each load point
- Measure DC output power independently with a calibrated DC voltmeter and ammeter or DC power analyzer
- Record V, I, P, S, PF, and THD at each load point
- Compute efficiency as: η = P_DC_out / P_AC_in × 100%
Real-World Example: The 36-Percentage-Point Efficiency Gap
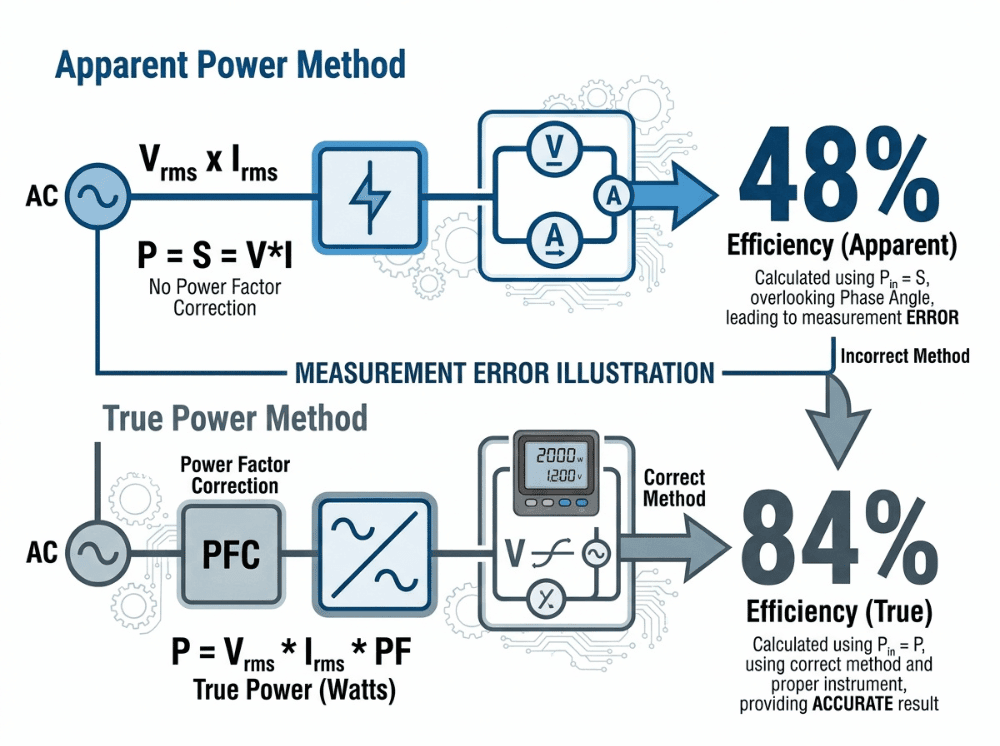
To illustrate how large this error can be in practice, consider the following illustrative lab scenario based on a 20W AC-DC switching supply measured at 115V/60Hz AC input, operating at 50% load without active PFC:
Measurement Method | AC Input Reading | DC Output | Calculated Efficiency |
|---|---|---|---|
Apparent power (V × I_rms) | ~24.8 VA | 12.0 W | ~48% |
Real power (true wattmeter) | ~14.3 W | 12.0 W | ~84% |
The same supply. The same operating point. A 36-percentage-point difference in reported efficiency, driven entirely by a power factor of approximately 0.58 at that load condition.
Reporting the 48% figure would suggest the supply is a poor candidate for DoE Level VI compliance. The 84% figure—the accurate one—tells a different story. In a real product evaluation, this kind of measurement error can lead to unnecessary redesigns, premature supplier disqualification, or missed compliance targets that only surface at a third-party audit.
The difference narrows at full load and in supplies with active PFC, but it does not disappear. At light loads, where THD peaks and power factor drops, the gap tends to be widest—which is precisely where efficiency standards are most demanding.
Regulatory Requirements: EN 61000-3-2 and DoE Level VI
Both of these frameworks have direct implications for how AC-DC power supply efficiency must be measured and reported.
EN 61000-3-2 (Electromagnetic Compatibility – Limits for Harmonic Current Emissions) sets maximum allowable harmonic current levels for equipment connected to public low-voltage supply systems. Equipment in Class D (which includes switched-mode power supplies between 75W and 600W) must meet per-watt harmonic limits at defined input power levels. Demonstrating compliance requires harmonic current measurements, which in turn require a true-power meter capable of harmonic analysis—not just an RMS voltmeter and ammeter.
Mischaracterizing the input power due to poor measurement practice can lead to incorrect classification of the supply’s harmonic profile, resulting in a compliant-looking internal test that fails under laboratory conditions.
DoE Level VI (U.S. Department of Energy External Power Supply efficiency standards, implemented under 10 CFR Part 430) mandates minimum efficiency thresholds for external power supplies at four load conditions: 100%, 75%, 50%, and 25% of rated output. The required average efficiency varies with rated output power, with higher-power supplies subject to stricter thresholds.
All four test points require accurate real power measurement. The 25% load point is often the most challenging—both because efficiency tends to be lower at light loads and because power factor (and therefore the VA-to-W gap) is typically worse at this condition. Efficiency figures derived from apparent power at 25% load will be systematically underestimated, potentially creating a false non-compliance result.
DoE Level VI testing also specifies measurement uncertainty requirements. Instruments must meet defined accuracy classes for voltage, current, and power—requirements that clip-on probe setups and general-purpose oscilloscopes typically cannot satisfy.
Measurement Protocol: Load Conditions and Power Factor Behavior
The table below summarizes how power factor typically behaves across load conditions in a switching supply without active PFC, and what this means for measurement accuracy:
Load Condition | Typical PF (no PFC) | Typical PF (with PFC) | Measurement Risk |
|---|---|---|---|
100% | 0.65–0.75 | 0.95–0.99 | Moderate |
75% | 0.58–0.68 | 0.93–0.98 | Moderate–High |
50% | 0.50–0.62 | 0.90–0.96 | High |
25% | 0.45–0.58 | 0.85–0.93 | Highest |
Supplies with active PFC significantly reduce the gap, but even at 0.93 PF, a measurement based on apparent power will report an efficiency approximately 7% lower than the true value. Over multiple test points and multiple units, this level of error is not acceptable for compliance documentation.
For DoE Level VI testing, the test voltage must also be correct: 115V ± 1% at 60 Hz ± 1 Hz for North American compliance, and 230V ± 1% at 50 Hz ± 1 Hz for EU compliance. Many internal test setups use unregulated benchtop supplies that do not meet this specification, introducing additional measurement uncertainty.
How Quankang Supports Compliance Validation
Quankang’s approach to power supply manufacturing is built on the assumption that test accuracy is a product-quality issue, not just a procedural requirement. With 36 years of AC-DC power supply development experience, 212 active patents, and an on-site EMC laboratory, Quankang’s engineering team conducts pre-compliance testing using measurement protocols aligned with EN 61000-3-2 and DoE Level VI requirements before products leave the factory.
For ITE power supplies—including industrial and commercial-grade units certified to DoE Level VI and ErP Lot 7—Quankang’s pre-shipment validation includes harmonic current measurement and real power efficiency verification at all four DoE load points. For medical power supplies certified to IEC 60601-1, the same measurement rigor applies to input characterization, as well as to leakage current, isolation, and safety testing.
This matters in practice. Across more than 10,000 OEM projects, Quankang reports a 98.3% first-pass EMC compliance rate—a figure that reflects, among other things, the discipline of measuring what actually matters.
ODMs evaluating Quankang products receive full test documentation, including power factor data, harmonic current profiles, and efficiency figures at all required load points—measured with true-power instrumentation. This documentation is available before the purchase order stage, reducing the compliance risk that typically surfaces at third-party certification.
Stop Measuring Apparent Power and Calling It Efficiency
The measurement errors described in this article are not exotic edge cases. They occur routinely when engineers use standard benchtop instruments without verifying whether they measure real or apparent power, when THD is high, and power factor is not separately verified, and when load-point testing skips the 25% condition where the error is largest.
The fix is specific: use a true-power meter with sufficient bandwidth, document power factor and THD alongside efficiency at each load point, and apply the correct test voltages and integration times for the target compliance standard.
If you are evaluating AC-DC power supplies for an ITE or medical application and want components that arrive with compliance-ready test data, Quankang’s engineering team can provide pre-certified product recommendations and compliance validation support. Request a consultation or factory quote to discuss your application requirements and receive documentation aligned with your target certification pathway.
Frequently Asked Questions
What is the difference between apparent power and real power in AC-DC power supply testing?
Apparent power (VA) is the product of RMS voltage and RMS current. Real power (W) is the mean of the instantaneous products of voltage and current over a full cycle. In AC-DC switching supplies, these two quantities differ because the current waveform is non-sinusoidal—high THD reduces power factor below 1.0, creating a gap between VA and W. Only real power should be used to calculate efficiency.
Why does power factor affect the accuracy of AC-DC power supply efficiency measurements?
Power factor (PF) is the ratio of real power to apparent power. When PF is less than 1.0—as it typically is in switching supplies—using apparent power in the efficiency formula produces a result that does not reflect the actual energy conversion performance. At PF = 0.6, apparent power is 67% higher than real power, which can shift reported efficiency by 20–36 percentage points depending on the load condition.
What instruments are required for DoE Level VI efficiency testing?
DoE Level VI testing requires a true-power (wattmeter-class) analyzer capable of accurately measuring real power under four load conditions (25%, 50%, 75%, and 100% of rated output). The instrument must meet specified accuracy classes for voltage, current, and power measurement. Oscilloscopes with current probes generally do not meet these requirements due to phase error, limited dynamic range, and bandwidth constraints.
How does total harmonic distortion (THD) affect power supply efficiency measurements?
High THD increases the RMS current without increasing real power transfer, thereby lowering the power factor and widening the gap between apparent and real power. Switching supplies without active PFC typically exhibit THD of 80–120% at light loads, making the 25% load point—where DoE Level VI testing is most sensitive—the condition most susceptible to measurement error.
What harmonic current limits apply under EN 61000-3-2 for switched-mode power supplies?
EN 61000-3-2 Class D limits apply to switched-mode power supplies with rated input power between 75W and 600W. These limits specify the maximum harmonic current per watt at each harmonic order up to the 40th. Demonstrating compliance requires a power analyzer capable of harmonic decomposition of the input current, measured at the specified input power level using real power rather than apparent power.
Under what load condition is AC-DC power supply efficiency most difficult to measure accurately?
The 25% load condition presents the greatest measurement challenge. Power factor is typically lowest at light loads in supplies without active PFC, creating the widest gap between apparent and real power. THD is also typically highest at this condition. This is the point where measurement errors are most likely to produce false non-compliance results in DoE Level VI testing.
How can I verify that a power meter is measuring real power rather than apparent power?
Check the instrument specification for “true power,” “active power,” or “watt measurement.” Confirm that the measurement method involves direct V × I integration rather than phase-angle estimation. Test with a known resistive load—for a purely resistive load, real power and apparent power should be equal (PF = 1.0). If the instrument reads the same VA as W under a resistive load but a different W reading for a switching supply, it is measuring real power correctly.
Does active power factor correction (PFC) eliminate the need for accurate real power measurement?
Active PFC substantially reduces the gap between apparent and real power by shaping the input current waveform to be more sinusoidal, typically achieving PF of 0.93–0.99. However, PF remains below 1.0 even with active PFC, particularly at light loads. At PF = 0.93, apparent power still exceeds real power by approximately 7.5%—a difference that may be acceptable in some contexts but is not within the measurement uncertainty requirements for compliance testing.